Platform integrates with major wearables and fitness apps to deliver AI-powered health insights, advanced HRV metrics, stress analysis, and sleep tracking.
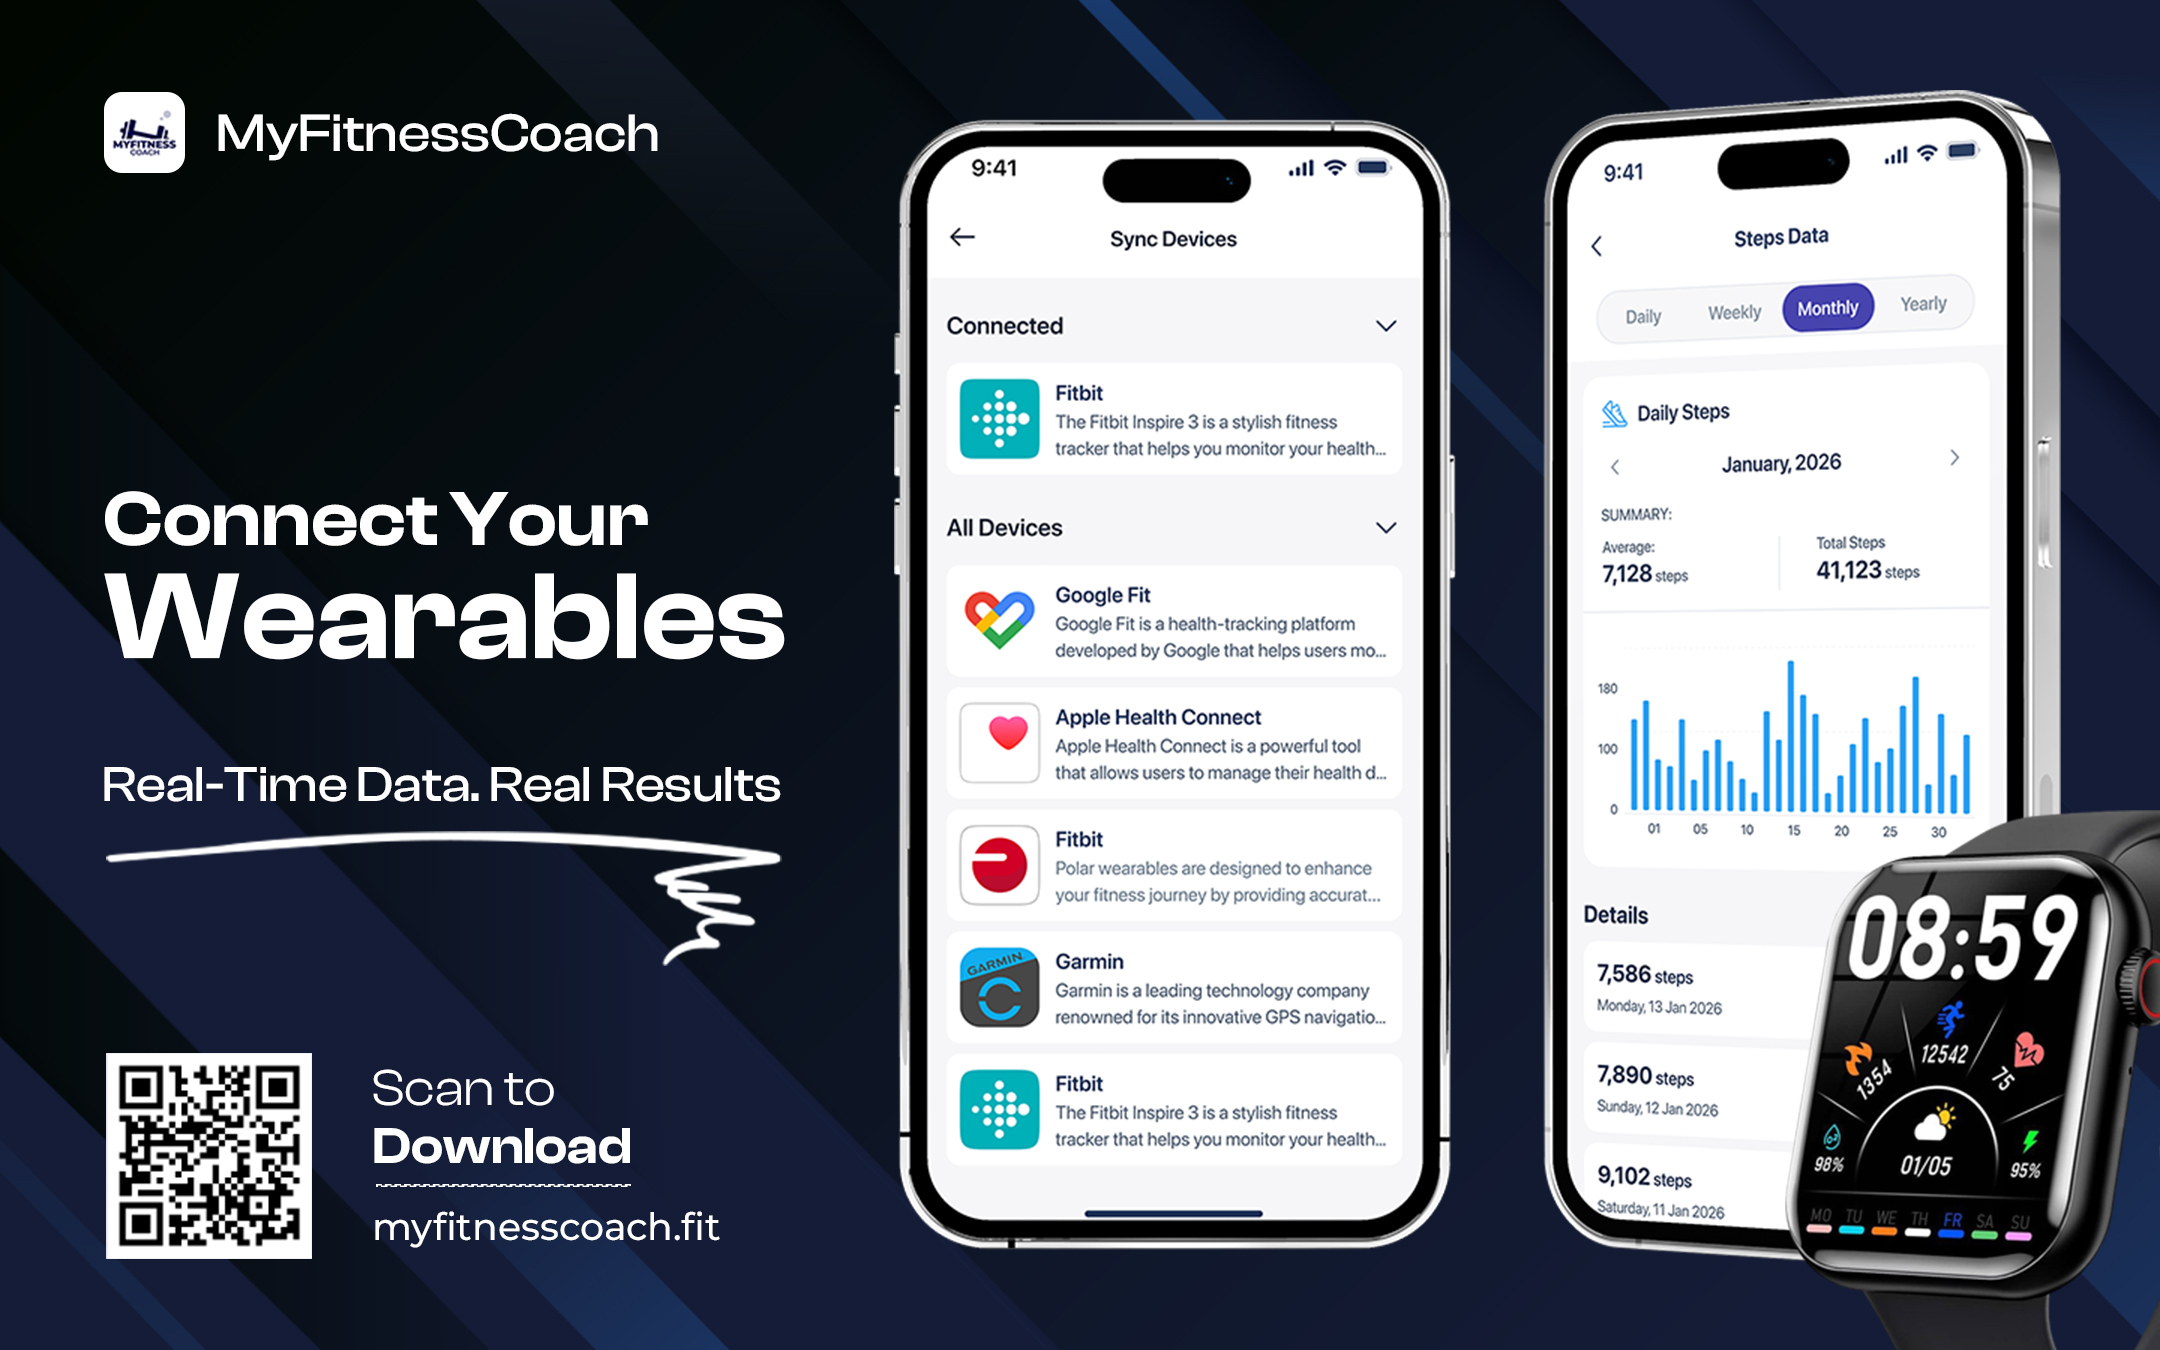
CA, UNITED STATES, March 7, 2026 /EINPresswire.com/ — MyFitnessCoach has introduced comprehensive wearable device and fitness app integration that transforms raw health data into actionable AI-powered insights. The new synchronization feature connects with leading wearables including Fitbit, Garmin, Apple HealthKit, Whoop, Withings, and Polar, alongside fitness platforms such as Strava, MapMyFitness, Wahoo, and RideWithGPS, creating a unified health tracking ecosystem with advanced analytics.
Modern fitness enthusiasts increasingly rely on multiple devices and applications to track different aspects of their health and activity. However, data fragmentation across platforms prevents users from obtaining comprehensive insights into their overall wellness. MyFitnessCoach addresses this challenge by aggregating data from diverse sources into a single dashboard with intelligent analysis capabilities that reveal patterns and correlations impossible to identify through individual platforms.
The integration system operates through secure API connections that respect user privacy while enabling seamless data flow. Users authorize specific permissions for each connected service, maintaining control over which data streams into MyFitnessCoach. Once connected, the platform automatically syncs new data in real-time, ensuring users always access current information without manual updates.
Apple HealthKit integration provides the most comprehensive data pipeline, collecting steps, distance, calories burned, heart rate, sleep patterns, blood oxygen levels, respiratory rate, and critically, heart rate variability measurements from Apple Watch. This depth of integration enables MyFitnessCoach to perform sophisticated analysis that requires multiple simultaneous data streams.
Heart rate variability analysis represents one of the platform’s most advanced capabilities. HRV measures the variation in time intervals between consecutive heartbeats, providing insights into autonomic nervous system function, recovery status, stress levels, and overall cardiovascular health. Apple Watch continuously monitors HRV throughout the day, capturing measurements during rest, activity, and sleep periods.
MyFitnessCoach processes this HRV data to calculate multiple sophisticated metrics. RMSSD (Root Mean Square of Successive Differences) quantifies short-term HRV variability, with normal ranges between 20 and 90 milliseconds. A reading of 46 ms indicates healthy adaptability to physiological demands. SDNN (Standard Deviation of NN intervals) measures overall HRV across extended periods, with normal ranges exceeding 30 milliseconds. A 60 ms reading suggests ample variation in heartbeat patterns, indicating solid adaptability over time.
The platform calculates pNN50, representing the percentage of successive heartbeat intervals differing by more than 50 milliseconds. Normal ranges fall between 5 and 40 percent. A reading of 27.27 percent indicates readily accessible periods of calm and renewal, allowing effective recharging when needed. This metric particularly reflects parasympathetic nervous system activity associated with rest and recovery.
Additional HRV metrics include AMo50 (amplitude of mode at 50 ms intervals), with normal ranges between 25 and 55 percent. Mean RR interval displays average time between heartbeats, with normal ranges from 600 to 1400 milliseconds. A reading of 889 ms shows appropriate responses to both exertion and quiet stillness. MxDMn measures the difference between maximum and minimum RR intervals, with normal ranges from 0.1 to 0.4 seconds.
CV (coefficient of variation) assesses heartbeat fluctuation proportional to average heart rate, with normal ranges between 4 and 8. A reading of 6.8 demonstrates excellent responsiveness, allowing seamless bodily adjustments to different situations. lnRMSSD represents the natural logarithm of RMSSD, with normal ranges from 3.2 to 3.8. This metric confirms enhanced parasympathetic influence supporting inner peace and ease.
Moda (mode) identifies the most frequently occurring RR interval value, typically ranging from 600 to 1000 milliseconds. A reading of 875 ms provides additional context for understanding heart rhythm patterns and consistency.
The platform synthesizes these individual metrics into a comprehensive HRV score displayed prominently on the wellness dashboard. The score ranges from poor to excellent, with visual indicators helping users quickly assess their current status. A score of 60 ms labeled “Moderate/Balanced” indicates generally healthy cardiovascular function with room for improvement. A score of 78 ms labeled “Excellent” reflects optimal HRV indicating strong recovery capacity and low stress.
Stress score calculation leverages HRV data alongside heart rate patterns to quantify physiological stress levels. The stress score ranges from 0 to 100, with normal ranges between 35 and 65. A stress score of 48 percent suggests the user has navigated challenges recently without excessive burden on their system. Lower scores indicate better stress management and recovery, while elevated scores may signal need for rest or stress reduction interventions.
AI-powered insights analyze HRV metrics, stress scores, heart rate data, sleep patterns, and activity levels to generate personalized recommendations. The AI system identifies trends across multiple data streams, recognizing patterns that might escape manual observation. When HRV scores trend downward while stress scores increase and sleep quality decreases, the AI recognizes this cluster of signals and provides targeted guidance.
The platform presents detailed parameter insights for each HRV metric, explaining what the measurement represents, the normal range, the user’s current value, and what this indicates about their physiological state. For RMSSD showing 46 ms within the normal 20-90 ms range, the insight explains that the user’s ability to adapt to changes feels strong, suggesting comfortable handling of life’s ups and downs.
For SDNN measuring 60 ms within the normal range exceeding 30 ms, the platform notes ample variation in heartbeat, indicating solid overall adaptability over time. The StressScore of 48 percent falling within the 35-65 normal range receives interpretation that the user seems to have navigated challenges recently without excessive burden upon their system.
When pNN50 measures 27.27 percent within the 5-40 percent range, the insight acknowledges that periods of calm and renewal feel readily accessible, allowing for effective recharging when needed. Heart rate measurements of 68 bpm within the 45-100 bpm normal range receive confirmation that resting heart rate reflects comfortable regulation during current daily activities.
Actionable suggestions translate data insights into concrete recommendations. When metrics indicate positive physiological status, the system encourages users to keep nurturing practices already working. Suggestions prioritize continued self-care by maintaining regular routines focused on quality sleep, nourishing foods, and mindful movement.
When metrics suggest elevated stress or declining recovery, recommendations shift toward interventions. The system might suggest reducing training intensity, increasing sleep duration, practicing stress management techniques, or consulting healthcare providers if concerning patterns persist.
The HRV and Wellness dashboard displays a visual timeline showing HRV scores throughout recent days. Users can navigate through dates to review how their HRV fluctuates over time. A bar chart displays scores by date, with color coding indicating quality levels. Red bars indicate lower scores requiring attention, yellow or orange bars suggest moderate scores, and green bars represent excellent scores.
Seven-day averages provide smoothed trend data that filters out daily noise. The dashboard shows average HRV, average heart rate, and average stress percentage across the past week. These rolling averages help users identify genuine trends versus temporary fluctuations caused by individual events.
Individual HRV readings appear as cards showing the timestamp, HRV score with quality label, current heart rate, RMSSD value, and stress percentage. Users can tap “Generate AI Insights” to receive detailed analysis of that specific reading, explaining what the metrics indicate about their physiological state at that moment.
Sleep tracking integration displays comprehensive sleep data including total sleep duration, sleep stages breakdown, and sleep quality metrics. The interface shows time in bed, actual sleep time, and percentages spent in different sleep stages. For a night showing 7 hours 1 minute of sleep, the breakdown might indicate 9 percent awake (43 minutes), 61 percent light sleep (4 hours 42 minutes), 15 percent REM sleep (1 hour 8 minutes), and 15 percent deep sleep (1 hour 11 minutes).
Visual sleep stage graphs display the sleep architecture throughout the night, showing transitions between awake, light, REM, and deep sleep stages. Different shades of blue distinguish the stages, with darker blues representing deeper sleep. This visualization helps users understand their sleep quality beyond simple duration metrics.
Heart rate data from wearables displays as continuous graphs showing beats per minute throughout the day. The interface shows minimum heart rate, maximum heart rate, average pulse, and resting heart rate. For a day’s data, this might show minimum 53 BPM, maximum 178 BPM, average 97 BPM, and resting 64 BPM.
Heart rate zones visualization breaks down time spent in different intensity levels. Normal zone (30-96 BPM) might show 2 hours 40 minutes, light zone (97-116 BPM) could indicate 12 minutes, fat burn zone (117-135 BPM) might display 24 minutes, cardio zone (136-164 BPM) could show 3 minutes, and peak zone (over 164 BPM) might indicate 1 minute. These zones help users understand activity intensity distribution throughout their day.
Steps data syncs from connected devices showing daily step counts with progress toward goals. A circular progress indicator displays current steps against target, such as 765 of 10,000 steps. Weekly trend graphs show step counts across the past seven days, helping users identify activity patterns and consistency.
Summary statistics for the past week include total steps, minimum daily steps, maximum daily steps, and average daily steps. These aggregated metrics help users understand their overall activity levels beyond individual days. A display might show 22,565 total steps with a minimum of 190 steps, maximum of 6,833 steps, and average of 2,821 steps.
Distance covered tracking shows kilometers or miles traveled based on step data and GPS activity tracking. Calories burned calculations incorporate activity data, heart rate information, and user profile details to estimate energy expenditure. Blood oxygen levels sync from compatible devices, showing SpO2 percentages. Respiratory rate measurements display breaths per minute. VO2 Max estimates appear when sufficient cardio data exists.
The fitness tracking overview dashboard presents all synchronized metrics in organized cards. Each card displays the metric name, current value, and date. Users can tap any card to view detailed graphs and historical data for that specific metric. This organization allows quick scanning of current status across all health dimensions.
Wearable device management occurs through the Sync Devices interface, which separates connected devices into two categories: Wearables and Fitness apps. The wearables section includes Fitbit, Garmin, Polar, Apple HealthKit, Whoop, and Withings. Each device listing shows the brand logo, device name, brief description, and connection status.
When a device shows “Connected” with a green indicator, users can disconnect it through a dedicated button. Disconnecting stops data synchronization from that source while preserving historical data previously imported. Users can reconnect devices at any time by re-authorizing the connection.
The fitness apps section includes Strava, MapMyFitness, Wahoo, and RideWithGPS. These platforms primarily contribute activity data like runs, rides, hikes, and other GPS-tracked workouts. Integration with these services allows users who prefer specific activity tracking apps to maintain their existing workflows while aggregating data in MyFitnessCoach.
Each integration partner receives a dedicated page explaining the service, available data types, and setup instructions. For Apple HealthKit, the page explains that users need to ensure their wearable connects to the Apple Health app via Bluetooth for data synchronization. Instructions guide users through granting MyFitnessCoach permission to access specific health data categories.
Data synchronization occurs automatically in the background once connections are established. Users don’t need to manually trigger updates or manage data transfer. The system checks for new data periodically and imports it seamlessly. This automation ensures users always view current information when opening the app.
Privacy controls allow users to selectively grant permissions for different data types. Someone might authorize step and heart rate data while declining to share sleep or location information. This granular control respects user privacy preferences while enabling desired functionality.
The platform stores synchronized data locally and in secure cloud storage, enabling cross-device access. Users can view their health data on smartphones, tablets, or web browsers with consistent information across all platforms. Data encryption protects information both in transit and at rest.
MyFitnessCoach offers both free and premium subscription tiers with varying integration capabilities. Free users can connect one wearable device and view basic synchronized data. Premium subscribers gain unlimited device connections, access to all integrated platforms, AI-powered insights, advanced HRV analysis, and comprehensive historical data with trend analytics.
The application is available on iOS and Android devices with full synchronization support for platform-specific integrations like Apple HealthKit on iOS. Cross-platform compatibility ensures users can access their health data regardless of which mobile operating system they prefer.
The wearable sync and AI insights features represent MyFitnessCoach’s commitment to leveraging technology for meaningful health understanding. By aggregating data from multiple sources and applying artificial intelligence to identify patterns and generate recommendations, the platform transforms disparate health metrics into cohesive wellness guidance.
MyFitnessCoach is a comprehensive fitness and wellness platform designed to support sustainable health through integrated approaches to nutrition, activity, recovery, and physiological monitoring. The application emphasizes long-term wellness and habit formation rather than extreme approaches or short-term results. As part of its broader fitness and wellness platform, MyFitnessCoach offers wearable integration, AI-powered health insights, HRV analysis, sleep tracking, nutrition monitoring, workout programs, and community features in one unified solution.
For more information about MyFitnessCoach and its wearable integration features, visit the official website or download the app from the iOS App Store or Google Play Store.
Bilal Athar
MyFitnessCoach.llc
bilal@myfitnesscoach.fit
Legal Disclaimer:
EIN Presswire provides this news content “as is” without warranty of any kind. We do not accept any responsibility or liability
for the accuracy, content, images, videos, licenses, completeness, legality, or reliability of the information contained in this
article. If you have any complaints or copyright issues related to this article, kindly contact the author above.
![]()